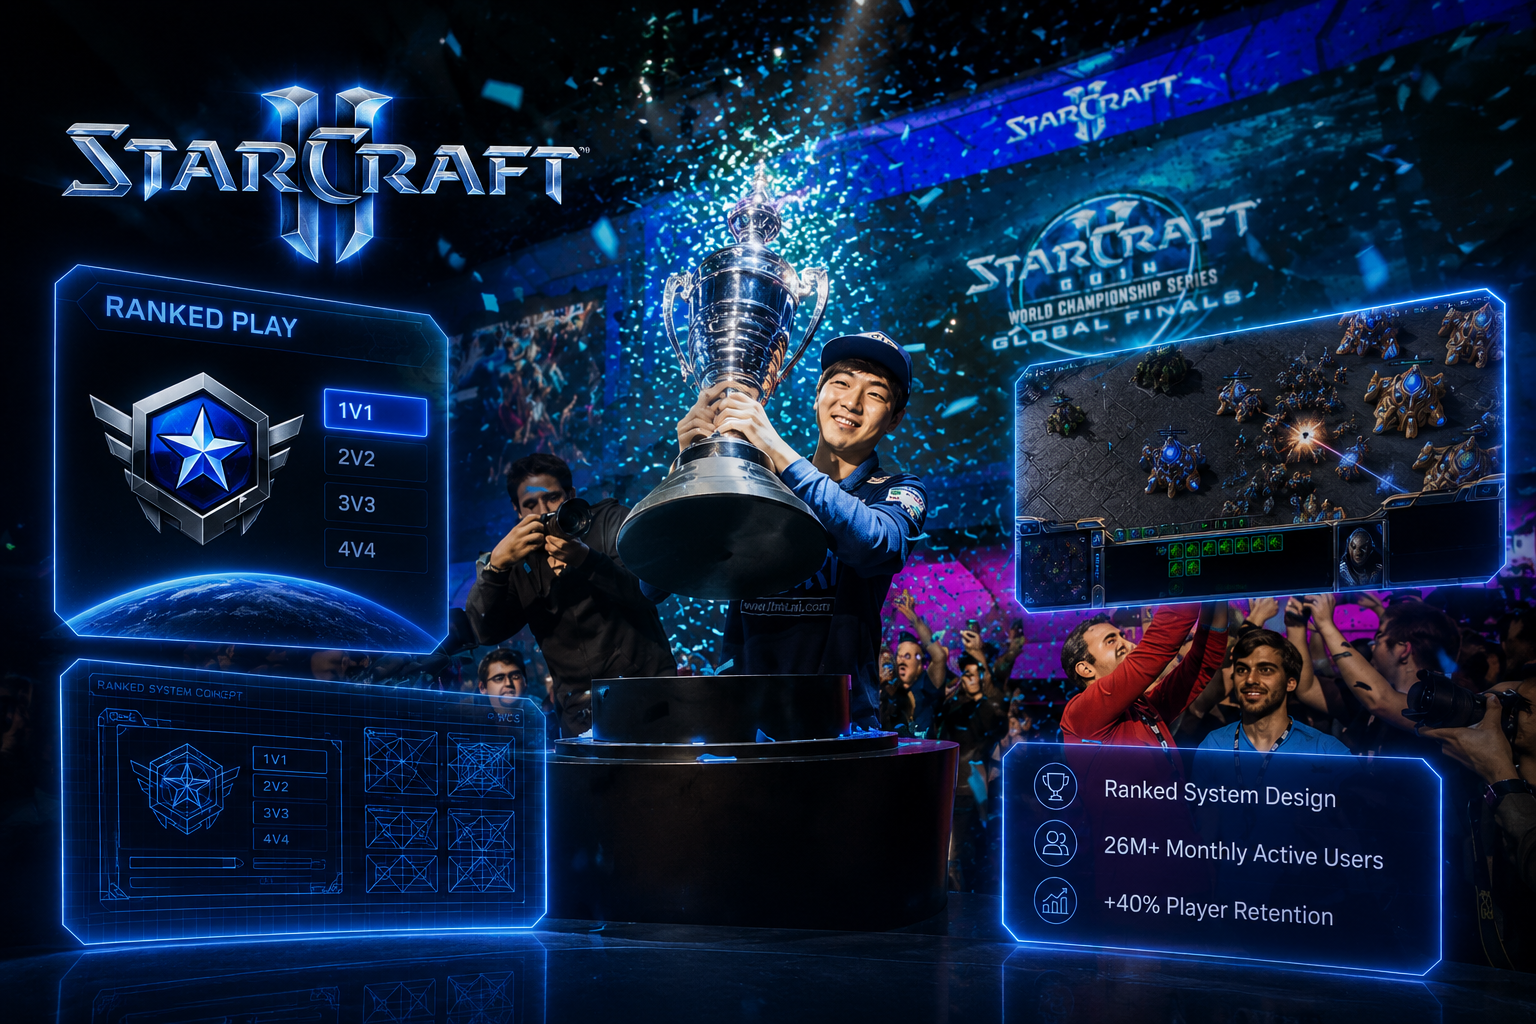
StarCraft 2 branding with competitive trophy win at the WCS Global Finals, alongside the Ranked Play interface showing 1v1/2v2/3v3/4v4 modes, a ranked-tier concept sketch, an in-game battle screenshot, and callouts for Ranked System Design, 26M+ Monthly Active Users, and +40% Retention
StarCraft II Competitive Ecosystem: System mechanics spanning 26M+ active users, combining global tournament esports validation with accessible ladder progression UI.
Case Study

Blizzard Entertainment — StarCraft 2 Ranked System Redesign

Role Systems Designer
Timeline 2010 – Jan 2015
Domain Gaming / Competitive Esports
Behavioral Design Qualitative + Quantitative Research Systems Architecture Cross-Functional Collaboration

Overview

StarCraft II's ranked ladder was one of the game's core competitive systems, defining how millions of active users measured skill, tracked progress, and earned recognition. As Lead UX Designer, I led the user experience for the ranking system, partnering with engineering and data science to shape each major iteration. We replaced the traditional numeric rating model with seven visual leagues, grounding competitive progression in visual identity while making rank easier to understand, celebrate, and aspire toward.
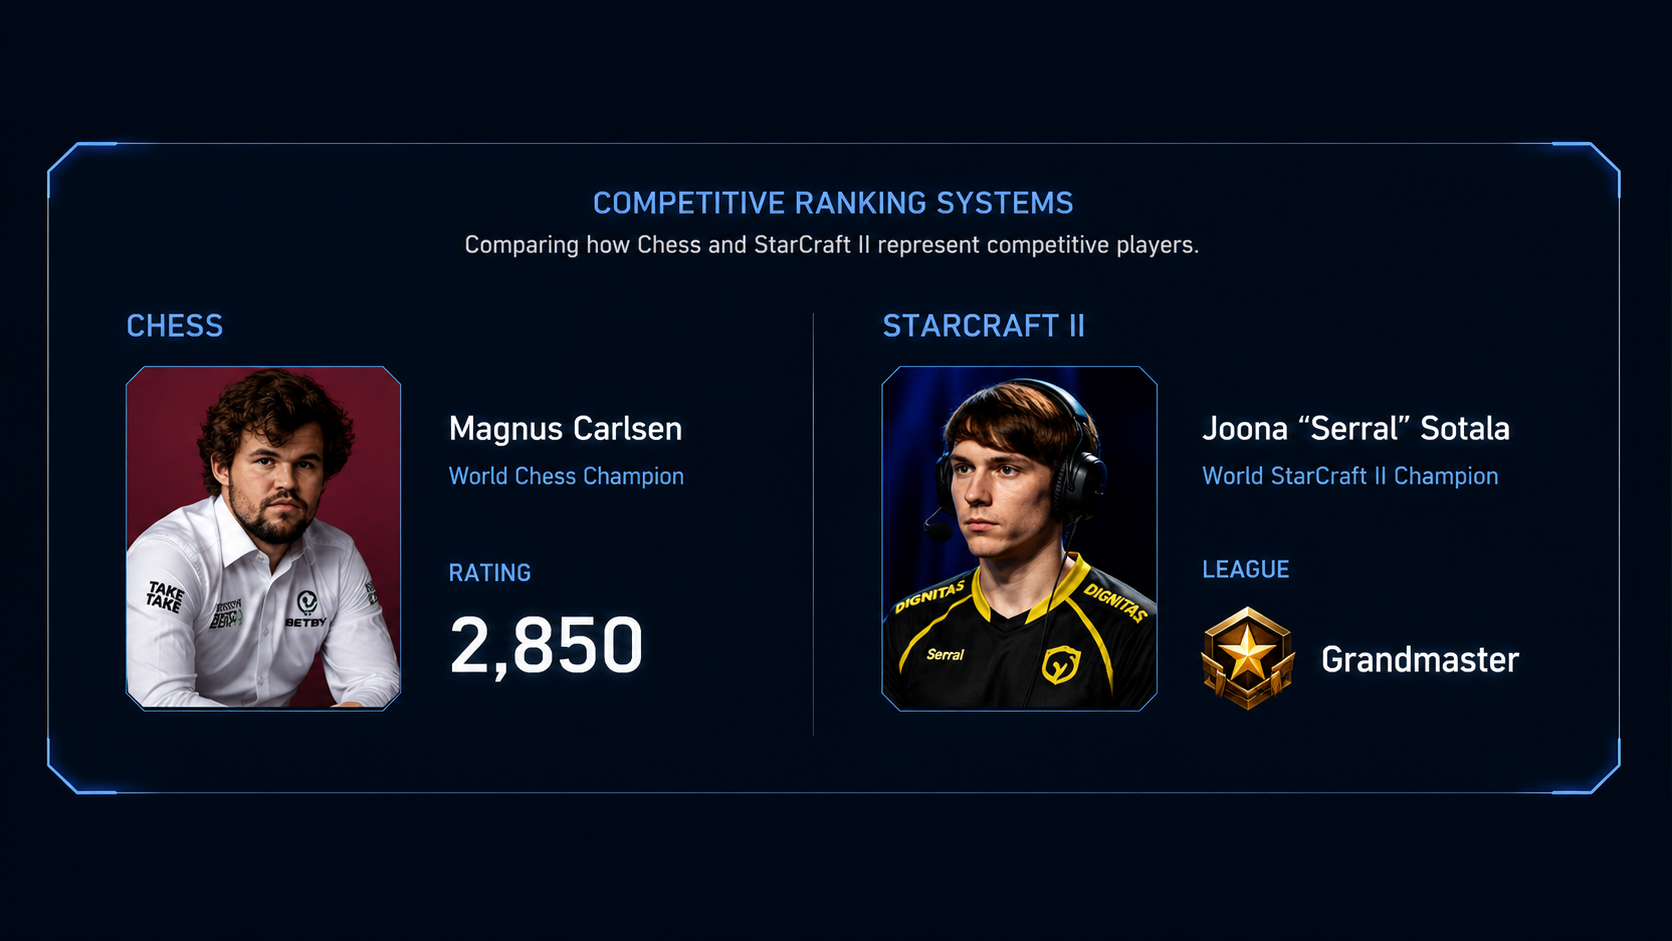
A dark comparison graphic titled Competitive Ranking Systems, comparing how Chess and StarCraft II represent competitive standing. On the left, a photo of Magnus Carlsen, World Chess Champion, with his rating: 2,850. On the right, a photo of Joona 'Serral' Sotala, World StarCraft II Champion, with his league: Grandmaster.
Elo Rating vs. Visual Identity: Unlike chess, which communicates competitive standing strictly through a numeric rating, StarCraft II represents it through visual leagues that anchor status and achievement.

Seven League Progression

Users progressed through seven visual leagues—Bronze, Silver, Gold, Platinum, Diamond, Master, and Grandmaster—creating a clear path from beginner to the highest levels of competition.
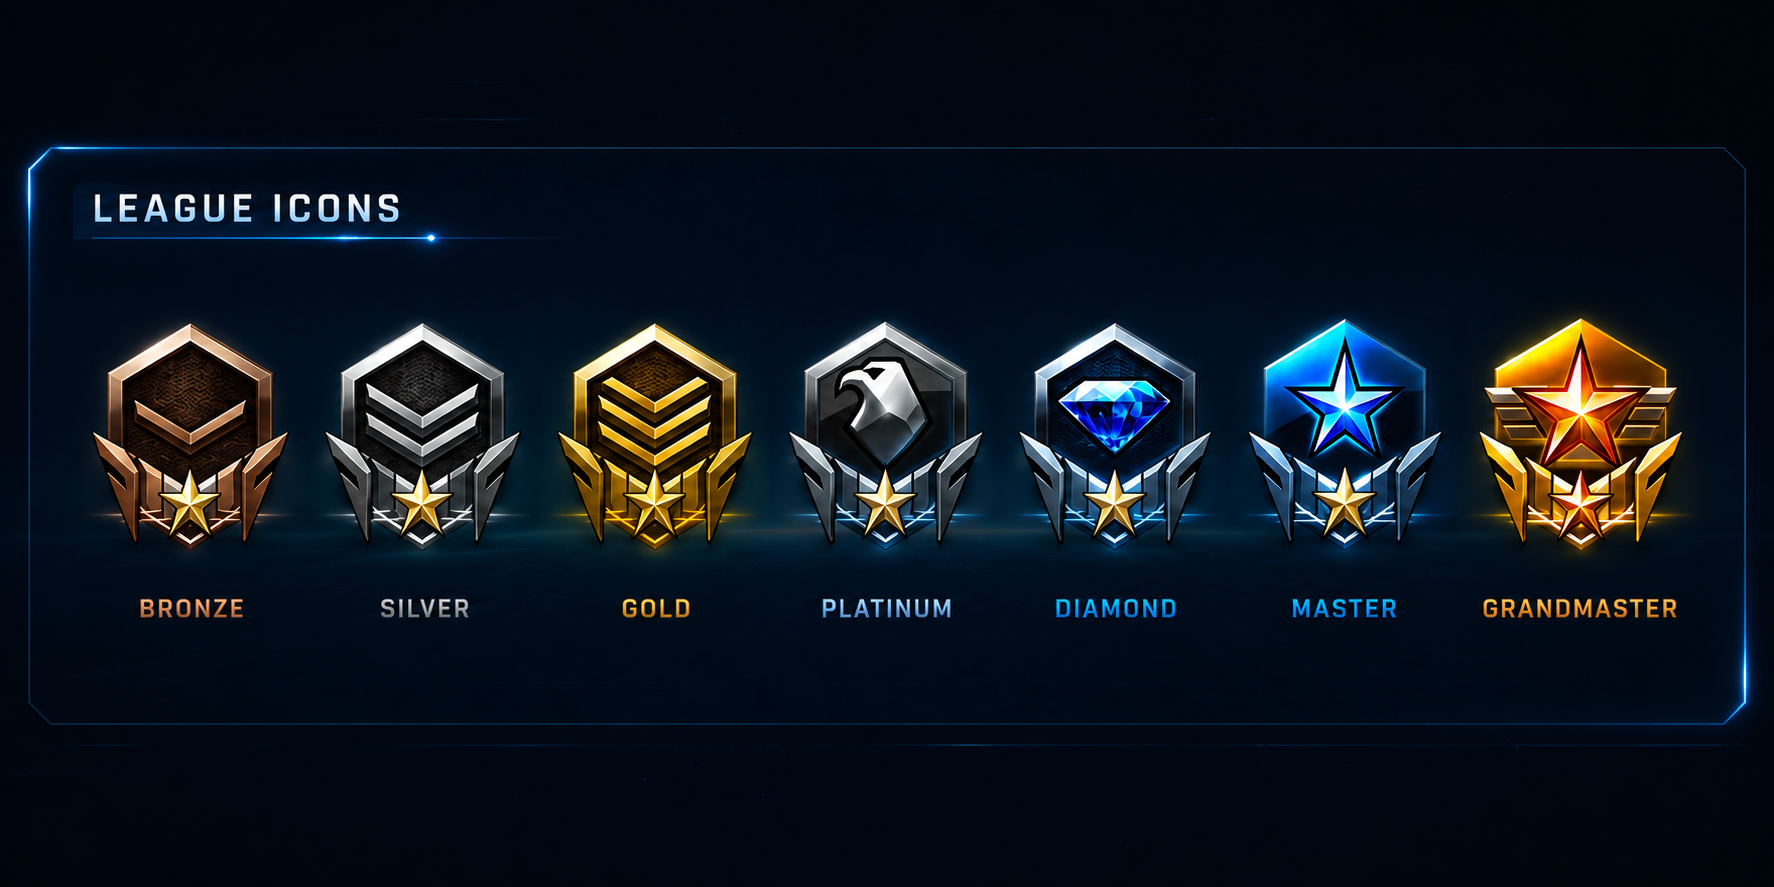
League icons representing each tier in the StarCraft 2 ranked system
Tier Identity System: Each league provided a distinct visual milestone from Bronze through Grandmaster, anchoring status and competitive ambition.

The Challenge

StarCraft II's ranked play was experiencing churn. Research revealed distinct user populations with different needs. Highly skilled accounts required rankings that accurately reflected capability, while less experienced cohorts needed enough positive reinforcement to sustain engagement.

Cross-Functional Validation

Qualitative research, quantitative analysis, and cross-functional collaboration shaped each iteration before active user telemetry validated the results.

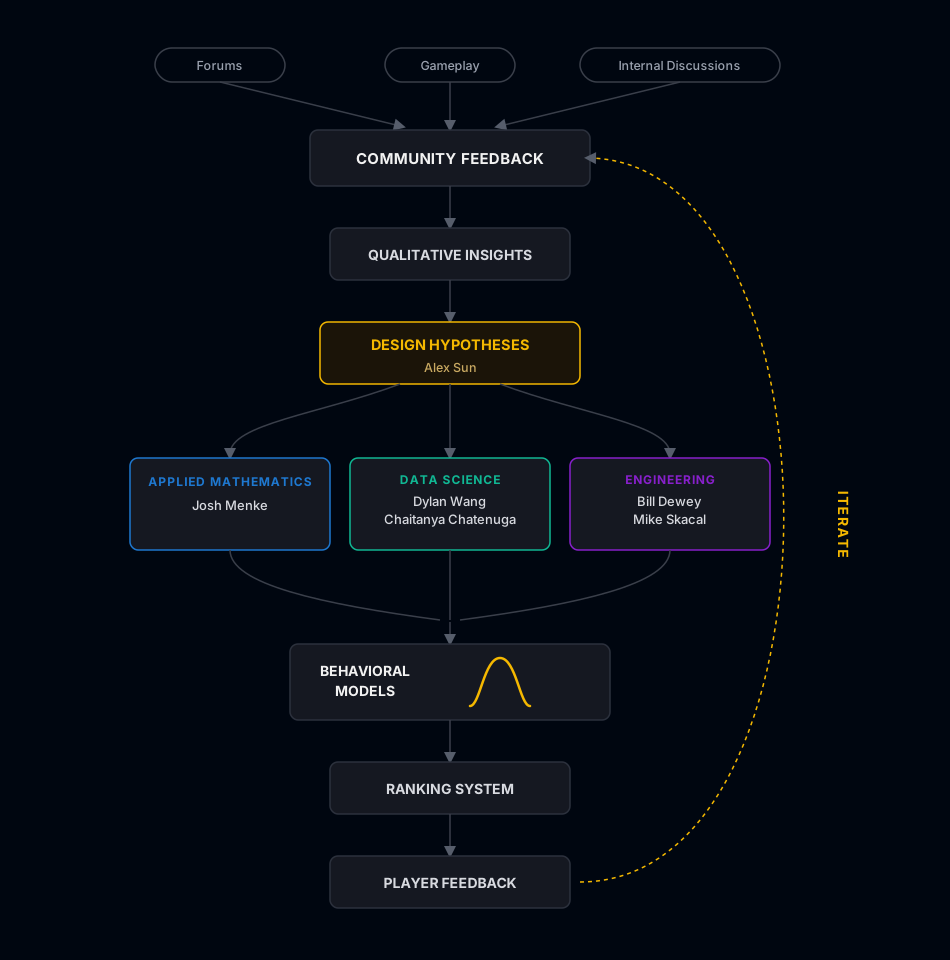
A vertical process diagram on a dark background. Three inputs — Forums, Gameplay, and Internal Discussions — feed into Community Feedback, which flows down to Qualitative Insights, then to Design Hypotheses, credited to Alex Sun. The process branches into three parallel disciplines: Applied Mathematics, led by Josh Menke; Data Science, led by Dylan Wang and Chaitanya Chatenuga; and Engineering, led by Bill Dewey and Mike Skacal. These three branches merge back into Behavioral Models, shown with a small bell curve icon, which flows into Ranking System, then User Feedback. A curved arrow labeled Iterate loops from User Feedback back up to Community Feedback, showing the cycle repeats.
Cross-Functional Systems Framework: Translating community feedback into UX hypotheses, validated alongside Applied Mathematics, Data Science, and Engineering partners.

Three Ranking Models

Each major release tested a different hypothesis. Findings from one model informed the next, moving the ranked system from population-based distribution to skill-based progression and ultimately to behavioral segmentation.

Iteration 1

Population-Based Tiers

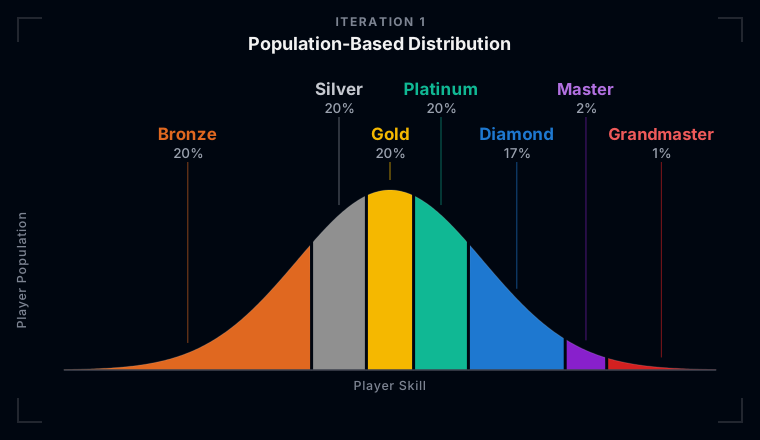
The initial design distributed the first five tiers evenly by volume. Each tier held 20% of active accounts, with Master and Grandmaster reserved for the top 3%. Feedback was initial positive, finding the distribution clear and easy to understand. This established the baseline.

A dark, polished distribution diagram shaped like a bell curve, divided into six colored bands representing the initial population-based tier design: Bronze at 20%, Silver at 20%, Gold at 20%, Platinum at 20%, Diamond at 17%, and a combined Master and Grandmaster band at the exclusive top 3%. A vertical axis label reads Active Distribution and a horizontal axis label below the chart reads Skill Rating. Each band is labeled with its league name and percentage along the top of the chart, connected by a colored guide line that extends down to just above the curve.
Population-Based Distribution (Iteration 1): Five equal 20% bands across the skill curve, with Master and Grandmaster reserved for the top 3%.
Iteration 2

Skill-Based Tiers

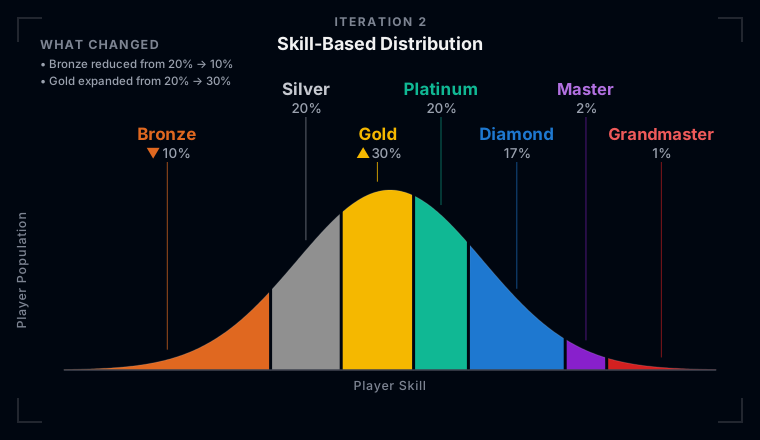
Qualitative feedback and MMR (Matchmaking Rating) analysis revealed that the league distribution no longer aligned with the underlying skill curve. Bronze and Silver contained too many accounts while Gold had too few. As proficiency improved, the league structure wasn't providing progression that reflected actual development.

I redesigned the league distribution around the skill curve, reducing the size of Bronze and Silver while expanding Gold.

A dark, polished distribution diagram shaped like a bell curve, showing the redesigned skill-based tier bands: Bronze reduced to 10%, Silver at 20%, Gold expanded to 30%, Platinum at 20%, Diamond at 17%, Master at 2%, and Grandmaster at 1%. Upward and downward triangle markers next to Gold and Bronze call out the expansion and reduction. An editorial callout in the upper-left corner, titled What Changed, notes that Bronze was reduced from 20% to 10% and Gold was expanded from 20% to 30%. A vertical axis label reads Active Distribution and a horizontal axis label below the chart reads Skill Rating. Each band is labeled with its league name and percentage, connected by a colored guide line that extends down to just above the curve.
Skill-Based Distribution (Iteration 2): Re-aligning tiers with real MMR data. Gold expands to 30% of active accounts while Bronze drops to 10%.
Iteration 3

Behavioral Segmentation

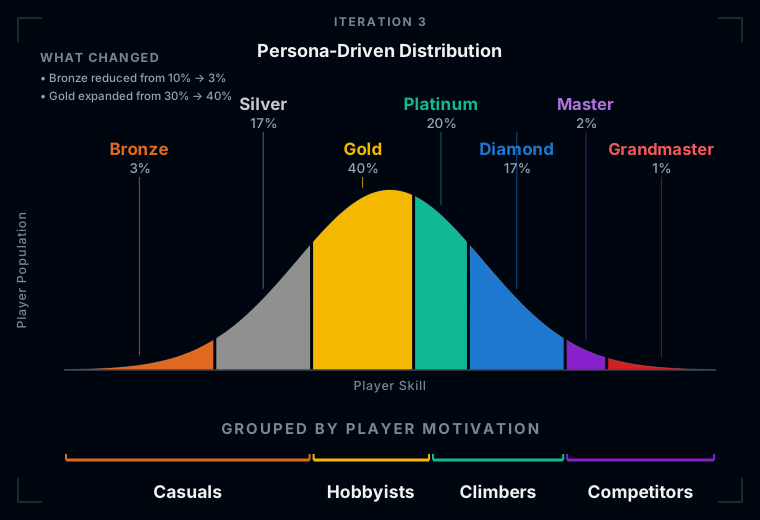
Even after the skill-based redistribution, retention issues persisted in Bronze and Silver. Telemetry analysis pointed to a systemic pattern: different skill tiers possessed fundamentally different motivations and responded to distinct feedback loops, meaning skill grouping alone was insufficient.

I led the telemetry analysis that identified four behavioral cohorts.

Competitors

Motivated by competitive accuracy. Rank needs to reflect true skill rating, and even minor rating inflation erodes trust in the ladder for this segment. Master and Grandmaster, top 5%.

Climbers

Value meaningful skill progression. Advancement milestones sustain long-term engagement, so the UI surfacing explicit progress indicators when a tier boundary is within reach. Platinum and Diamond.

Hobbyists

Broadly satisfied without being driven to advance. Progression indicators are intentionally calibrated to maintain competence sentiment without forcing tier advancement pressure. Gold.

Casuals

High churn risk. This segment responded to victory milestones rather than rating precision, leading to a wins-based model where progression occurs through match victories rather than pure MMR calculations. Bronze and Silver.

A dark, polished distribution diagram shaped like a bell curve, showing the final behavioral cohort tier bands: Bronze at 3%, Silver at 17%, Gold at 40%, Platinum at 20%, Diamond at 17%, Master at 2%, and Grandmaster at 1%. An editorial callout in the upper-left corner, titled What Changed, notes that Bronze was reduced from 10% to 3% and Gold was expanded from 30% to 40%. A vertical axis label reads Active Distribution and a horizontal axis label below the chart reads Skill Rating. Colored guide lines beneath each league name extend down to just above the curve. Below the chart, four colored bracket groups visually cluster the seven leagues into four behavioral cohorts: Casuals spanning Bronze and Silver, Hobbyists spanning Gold, Climbers spanning Platinum and Diamond, and Competitors spanning Master and Grandmaster.
Behavioral Segmentation Model (Iteration 3): Seven tiers grouped into four distinct target cohorts. Each cohort receives a tailored progression mechanic optimized for retention and motivation.

Result

The final system gave each behavioral cohort a distinct progression model. Casual tiers leveraged wins-based advancement rather than strict rating precision, which required decoupling lower-tier advancement logic from global match rating. Upper tiers remained strictly skill-based, maintaining integrity for high-end competition. Gold anchored 40% of the active base at the center of the distribution curve.

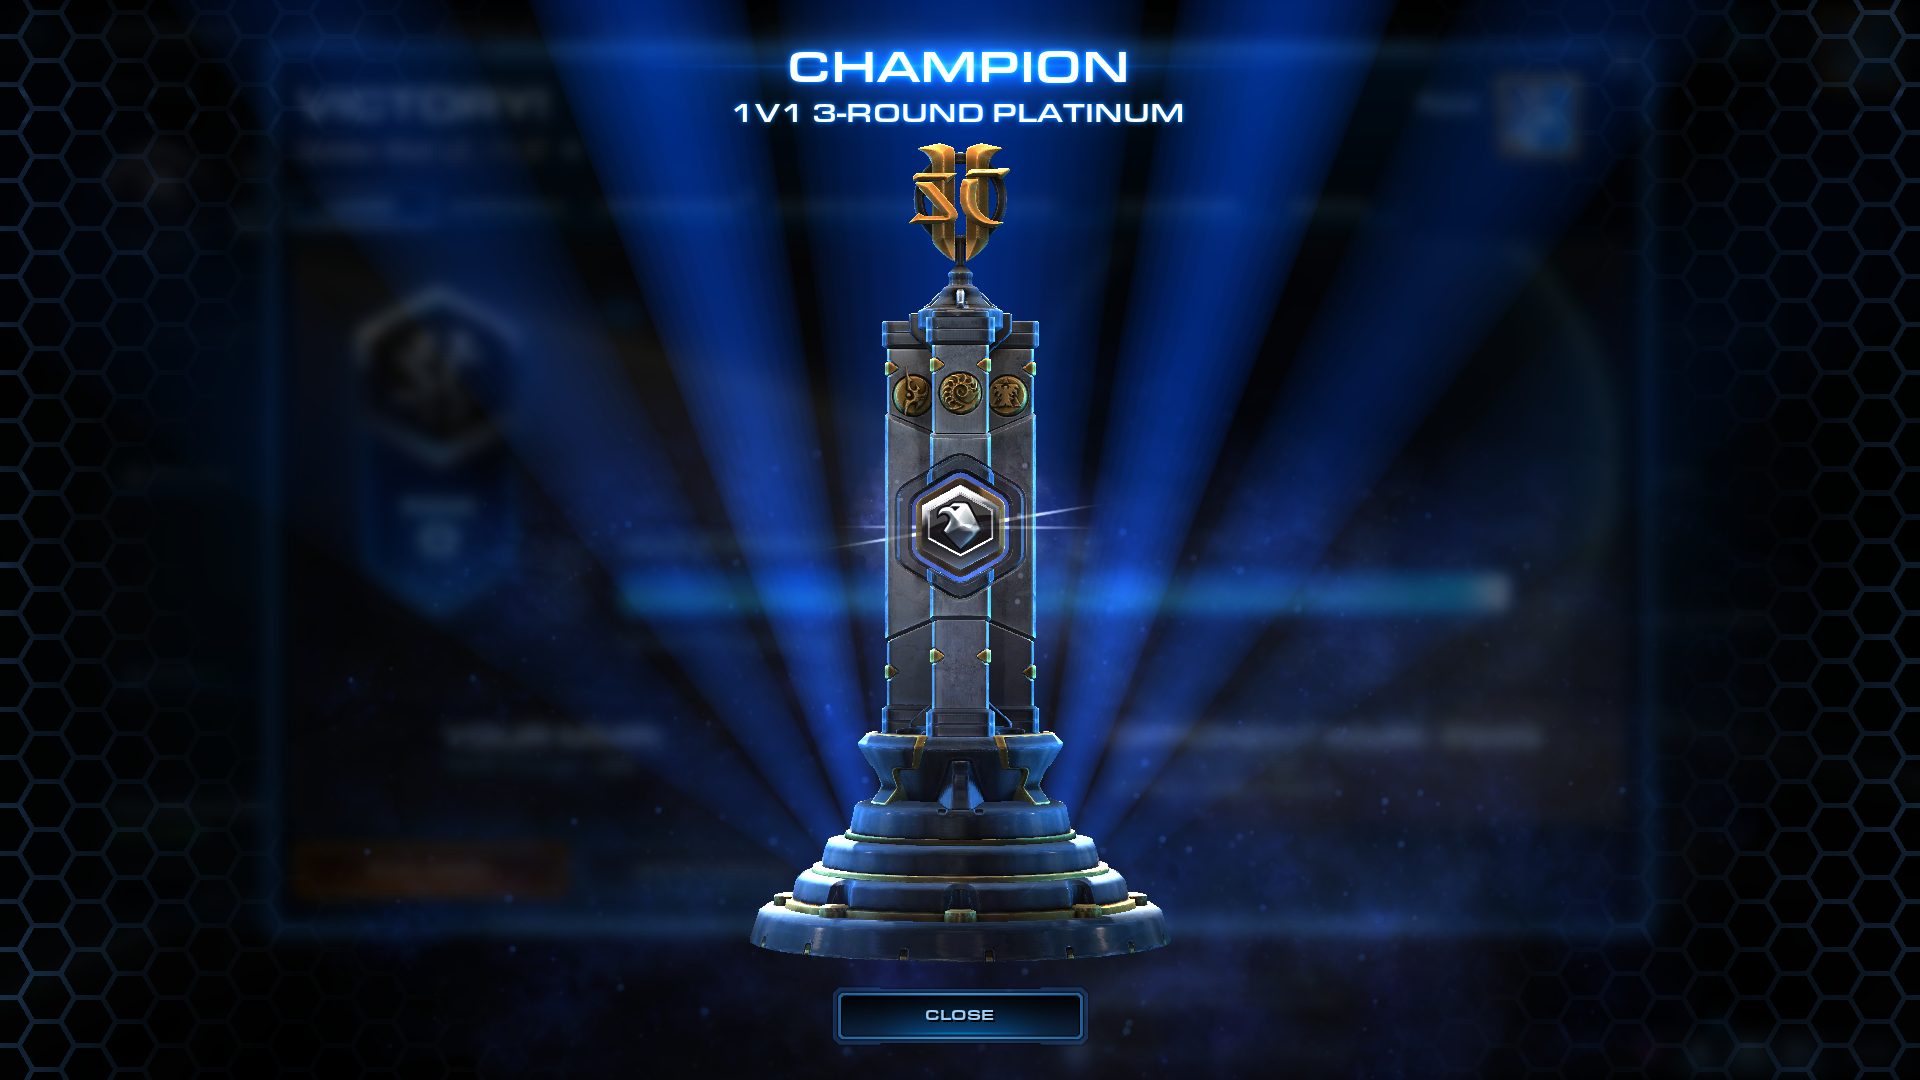
StarCraft 2 ranked trophy
Grandmaster Competitive Recognition: The ultimate visual trophy rewarding peak skill at the pinnacle of the StarCraft II ladder.

Impact

Quantitative Outcomes

Quantitative results measured against the prior major release and validated by internal data science teams.

+40%
User retention in ranked play

Recognition

I was invited as a guest speaker to the Wharton School of Business by Professor Kevin Werbach for his course "For the Win," on game design principles and behavioral motivation systems.